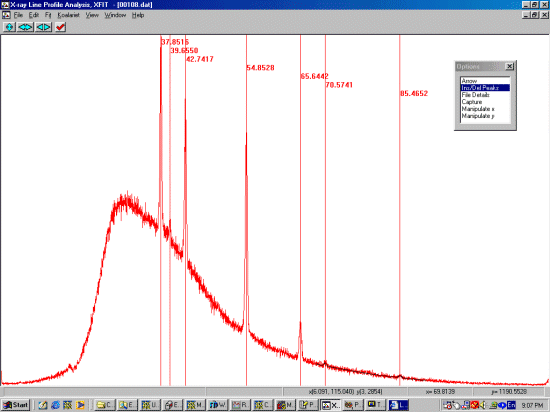
Obtaining XFITXFIT for Windows can be obtained via the XFIT download page |
Why bother and what's the solution
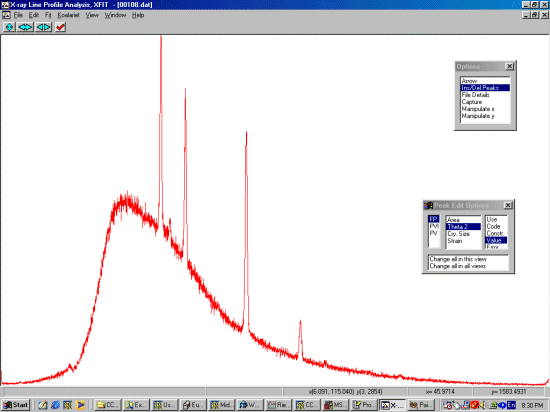
For fitting patterns with problematic backgrounds, there are various tricks that can be used. You may only find out which one works most effectively the hard way. We will be using method 4 from the following list under the assumption that other methods are not working effectively.
Please remember that if you are interested in peak areas, using a PVII - Split Pearson can be a dangerous peak function to use.
|
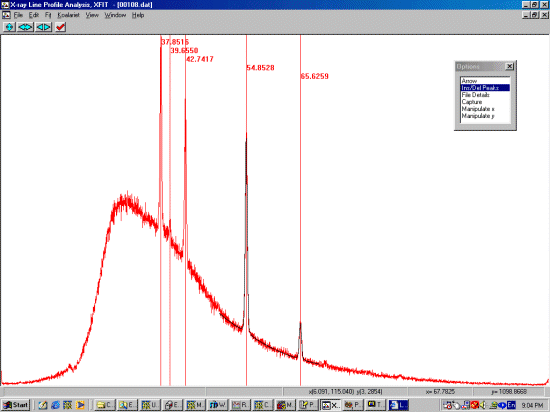
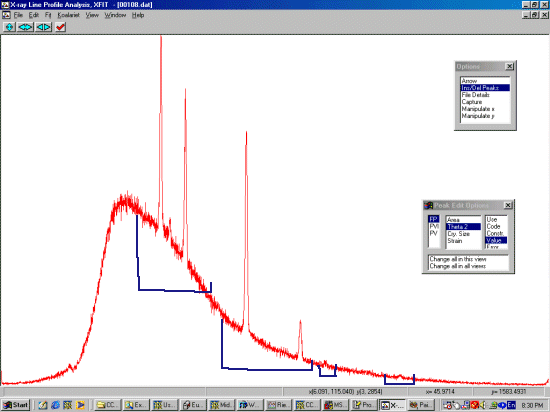
Fitting peaks with difficult backgrounds - defining the subranges to fitRun XFIT, select Load Data and load the pattern of interest.In this example, make an estimate of which ranges might be good to split things into. These can always be modified later. The following screen images shows 4 regions that I think would be good to fit things with. (This is single peak Energy Dispersive Diffraction data so there is no need to define a wavelength spectrum)
|
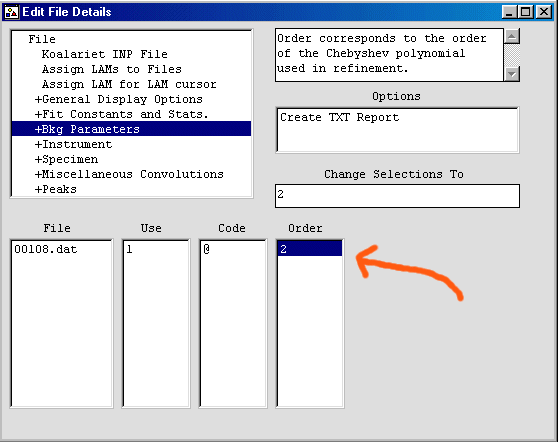
BackgroundFrom the options box, select File Details Then from the Edit File Details menu enable a 2nd order polynomial background by selecting Bkg Parameters, with an Order of 2
|
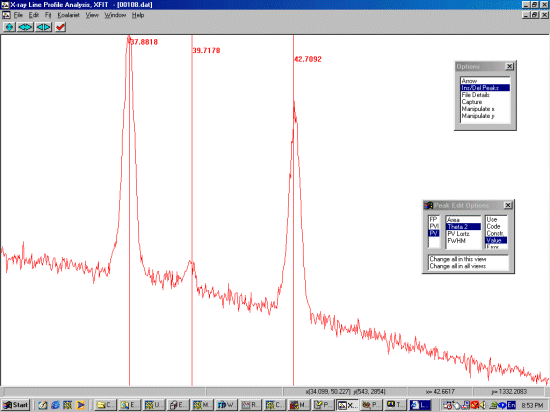
Fitting first sub-rangeUsing the arrow mode combined with the the left and right mouse keys, Zoom up on the range between 33 and 47. Select Ins/Del Peaks from the Options box. Select PV (Pseudo Voight) from the Peak Edit Options box. (the peaks are symmetric - if not, try using PVII (Split Pearson))
Put the mouse over a peak and click left mouse button to insert a peak (right mouse button to remove a peak). Repeat this for the observed peaks.
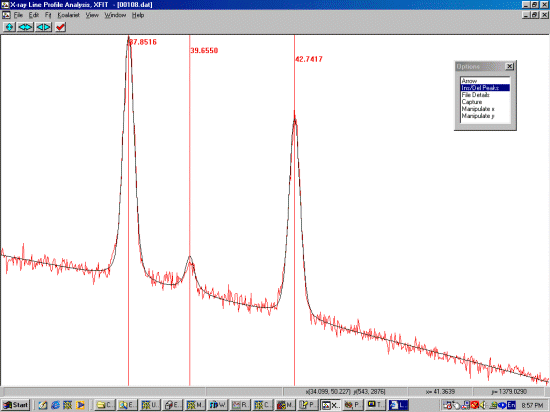
Now select Fit, Fit Marqardt to starting refining these peaks. This should happening routinely without problems. If not, you have have to combine a few other tricks such as forcing the peaks to be Gaussian or constraining overlapping peaks to have the same width and shape.
|
Fitting other sub rangesWith the plot window selected, select "s" from the keyboard to unzoom (lower case "s")
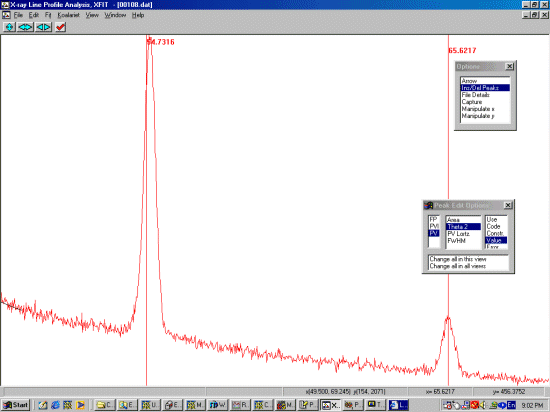
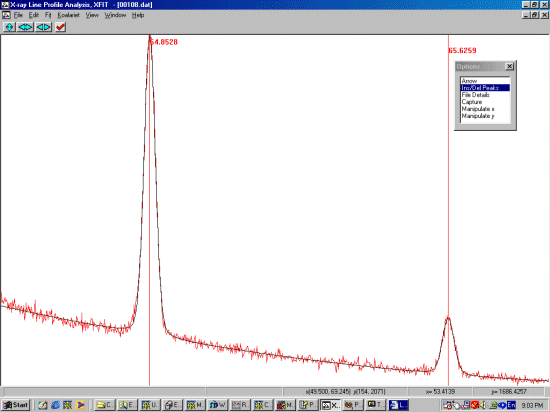
To now fit on the second range, using the arrow mode combined with the the left and right mouse keys, Zoom up on the range between 50 and 68. Select Ins/Del Peaks from the Options box. Select PV (Pseudo Voight) from the Peak Edit Options box. (the peaks are symmetric - if not, try using PVII (Split Pearson)) Put the mouse over a peak and click left mouse button to insert a peak (right mouse button to remove a peak). Repeat this for the observed peaks.
Now select Fit, Fit Marqardt to starting refining these peaks (XFIT only fits on the area visible on the screen). This should happening routinely without problems. If not, you have have to combine a few other tricks such as forcing the peaks to be Gaussian or constraining overlapping peaks to have the same width and shape.
With the plot window selected, select "s" from the keyboard to unzoom (lower case "s") |
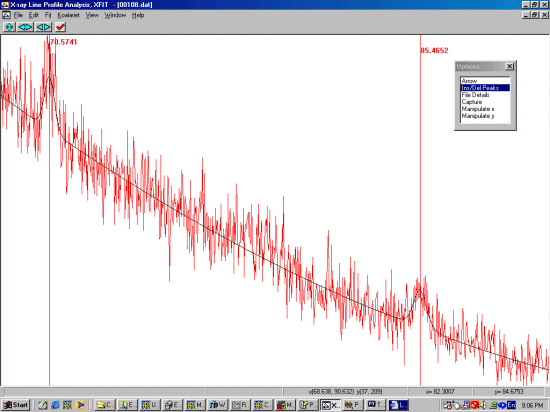
Fitting remaining sub ranges
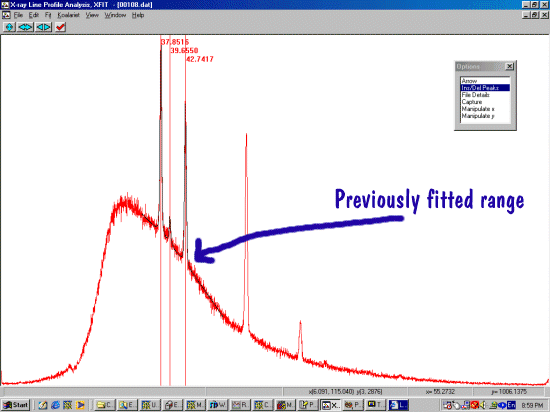
Just repeat the above until satisfied with the fit. You will note that trying some options out found this pattern was best fitted in three separate ranges (not 4)
The finished unzoom result.
|