CCP14
Tutorials and Examples
Peak Fitting using Xfit-Koalariet (Coelho and Cheary) for Win95/NT
Constraining Peak Widths
The CCP14 Homepage is at http://www.ccp14.ac.uk
[The reference to use for XFIT or FOURYA in any resulting publications is:
Cheary, R. W. & Coelho, A. A. (1996). Programs XFIT and FOURYA, deposited in CCP14 Powder Diffraction Library,
Engineering and Physical Sciences Research Council, Daresbury Laboratory, Warrington, England.
(http://www.ccp14.ac.uk/tutorial/xfit-95/xfit.htm)]
The Problem
Following is an example using simulated data showing how
with unconstrained peak widths, you can get a variety of
results. But with peak-widths constrained to be the same
values, results more consistent with the true values.
In this case the datasets consists of the following, but we
will only dot his on widths\3010.xdd:
The two PV peaks has the following values:
pk1:
area = 100
th2 = 30
FWHM = 0.2
PV-lortz = 0.5
pk2:
area = 100
th2 = 30.1 for 3010.xdd, 30.15 for 3015.xdd
and 30.20 for 3002.xdd
FWHM = 0.2
PV-lortz = 0.5
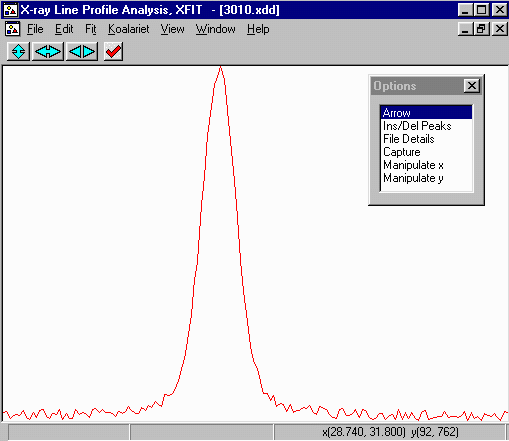
- Run XFIT, (maximise the screen if you wish)
and do File, Load Data and open
the widths\3010.xdd dataset. You can maximize the data to
fit the entire XFIT screen. It should look something like
the following. (if you can't see the active mouse output on
the bottom right of the XFIT screen - maximise your XFIT
window)
- If you fit these without any constraints, the values you obtain
depend on the starting peak positions. E.g.,
Peak1 Peak2 Area1 Area2 FWHM1 FWHM2
True Results: 30.0 30.1 100 100 0.2 0.2
Starting Starting Refined Refined Refined Refined Refined Refined
Peak 1 Peak 2 Peak1 Peak2 Area1 Area2 FWHM1 FWHM2
29.9907 30.0818 29.9873 30.0787 67 133 0.202 0.215
29.9907 30.0818 29.9868 30.0784 66 134 0.202 0.215
29.8450 30.2639 29.9864 30.0483 0 200 0.396 0.242
30.0211 30.0514 29.9875 30.0788 67 133 0.202 0.215
29.8936 30.0454 29.9523 30.0503 5 193 0.170 0.241
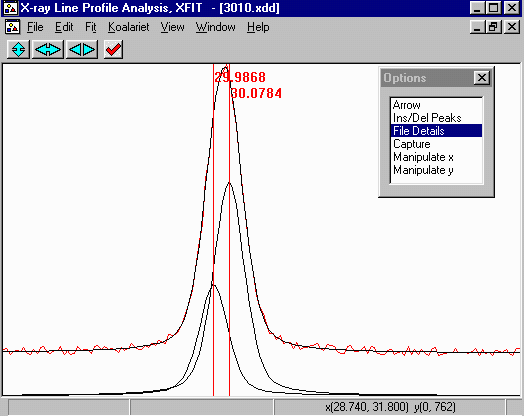
- As you can see from the following, this example fit from
one of the above looks superficially quite excellent - if you
are ignorant of the true value.
- To link the widths of the peaks together. You can either:
- delete the old peaks, add two new peaks and
constrain the widths.
- Or you can keep these peaks; fix the widths to the
identical numeric value;
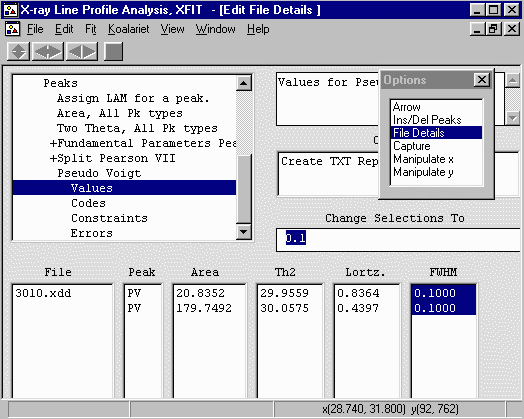
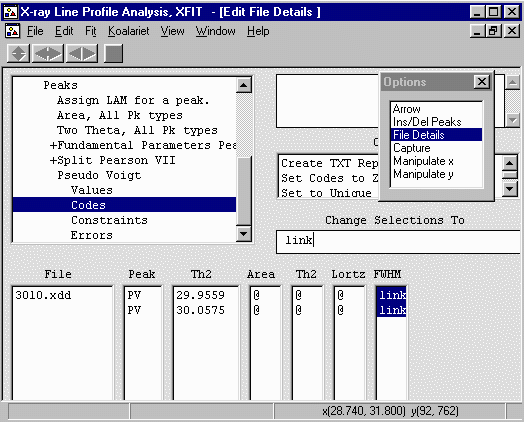
- Taking the second option, first go into File Details, Peaks,
Pseudo Voight, Values and set the two peak FWHMs to be the same.
To do this, click and drag to select the peaks, then in the
Change Selections To change to a suitable value (in this case
a FWHM of 0.1).
- Then go into the Codes section and link the
FWHMs together by using a suitable/arbitrary code-word (in this case
link).
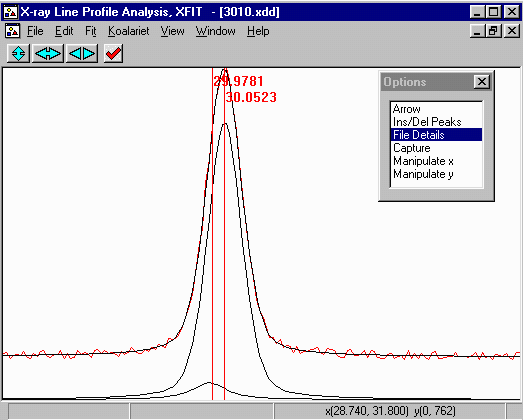
- Refining on this .
Peak1 Peak2 Area1 Area2 FWHM1 FWHM2
True Results: 30.0 30.1 100 100 0.2 0.2
Starting Starting Refined Refined Refined Refined Refined Refined
Peak 1 Peak 2 Peak1 Peak2 Area1 Area2 FWHM1 FWHM2
29.9907 30.0818 30.0003 30.0878 90 110 0.210 0.210
29.8450 30.2639 30.0003 30.0878 90 110 0.211 0.211
30.0211 30.0514 30.0003 30.0878 90 110 0.211 0.211
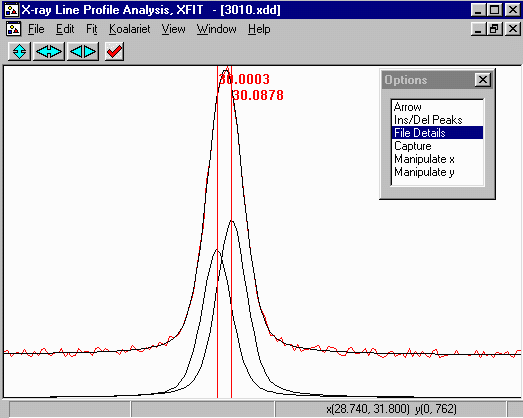
Though it is still possible to get into false minima even
with this FWHM constraint. Using appropriate constraints such
as this makes it more likely that with repeated tries, you will
get closer to a truer value more consistently than false values
Peak1 Peak2 Area1 Area2 FWHM1 FWHM2
True Results: 30.0 30.1 100 100 0.2 0.2
Starting Starting Refined Refined Refined Refined Refined Refined
Peak 1 Peak 2 Peak1 Peak2 Area1 Area2 FWHM1 FWHM2
29.8936 30.0454 29.9726 30.0522 15 184 0.238 0.238