CCP14
Tutorials and Examples
Peak Fitting using Xfit-Koalariet (Coelho and Cheary) for Win95/NT
Including individual peak profiles for Publication Quality Output
The CCP14 Homepage is at http://www.ccp14.ac.uk
[The reference to use for XFIT or FOURYA in any resulting publications is:
Cheary, R. W. & Coelho, A. A. (1996). Programs XFIT and FOURYA, deposited in CCP14 Powder Diffraction Library,
Engineering and Physical Sciences Research Council, Daresbury Laboratory, Warrington, England.
(http://www.ccp14.ac.uk/tutorial/xfit-95/xfit.htm)]
- To get a publication quality output that includes each peak profile;
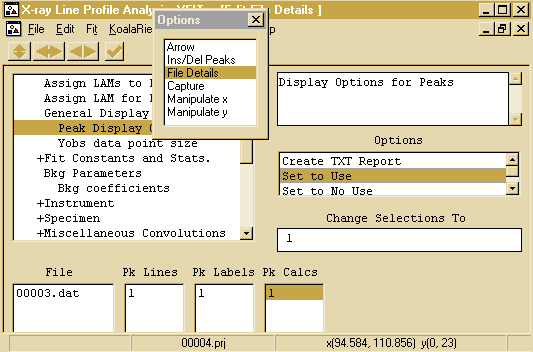
- From the Options Box, select File Details, General Display
Options, Peak Display Options. Highlight the Pk Calcs
for each peak you wish to see in the output and click on the
Set to Use in the Options box

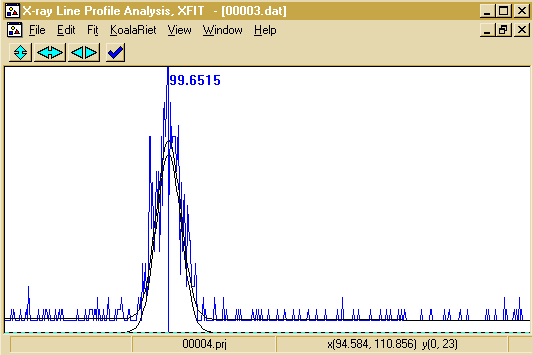
- Because of the lack of overlap and low backgrounds in this example,
the separate peak profiles at the bottom are not obvious but
we have zoomed up to show this effect.

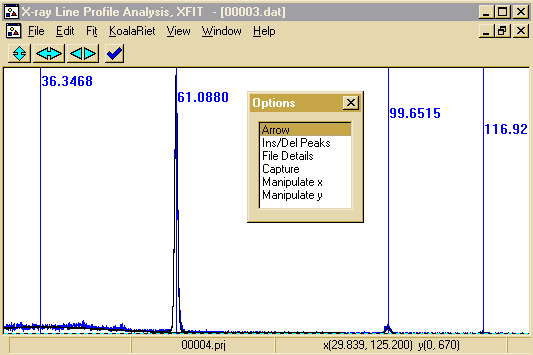
- Zoom up to the area you wish to get the pulication quality
output data for. In this case the data will go from
~29.839 to ~125.2.

- From the top menu bar, use the Edit, Create xy Report. And
save the file when prompted.

- Then import the files into your favourate spreadsheet
graphing program (the difference can be calculated in the
spreadsheet) for graphing.
The file would look something like the following, an extra two columns
for each peak:
00003.dat                 00003.dat                 00003.dat                 00003.dat                 00003.dat                 00003.dat
x            Yobs         x            Ycalc        x            Peak         x            Peak         x            Peak         x            Peak
29.8156      14.0000      29.8156      14.9063      29.8156      13.0583      29.8156      0.0055       45.4145      0.0000       92.3138      0.0002
29.8499      18.0000      29.8499      14.9267      29.8499      13.0782      29.8499      0.0055       45.4487      0.0000       92.3481      0.0002
29.8841      17.0000      29.8841      14.9471      29.8841      13.0980      29.8841      0.0056       45.4830      0.0000       92.3823      0.0002
29.9183      16.0000      29.9183      14.9673      29.9183      13.1177      29.9183      0.0056       45.5172      0.0000       92.4165      0.0002
29.9525      14.0000      29.9525      14.9875      29.9525      13.1374      29.9525      0.0056       45.5514      0.0000       92.4507      0.0002
29.9867      18.0000      29.9867      15.0076      29.9867      13.1570      29.9867      0.0056       45.5856      0.0000       92.4849      0.0002
30.0209      16.0000      30.0209      15.0276      30.0209      13.1765      30.0209      0.0056       45.6198      0.0000       92.5191      0.0002
30.0551      12.0000      30.0551      15.0476      30.0551      13.1960      30.0551      0.0056       45.6540      0.0000       92.5533      0.0002
.
.
.
.
125.1194     1.0000       125.1194     1.0043       125.1194     0.0000
125.1536     1.0000       125.1536     1.0042       125.1536     0.0000
125.1878     1.0000       125.1878     1.0042       125.1878     0.0000
125.2220     1.0000       125.2220     1.0041       125.2220     0.0000


