CCP14
Tutorials and Examples
Manual Powder Indexing and Peak Profiling with Brian Toby's CMPR Toolkit (Windows and UNIX)
Basic Run Through of Manual Powder Indexing
The CCP14 Homepage is at http://www.ccp14.ac.uk
From either an Icon in MS-Windows (or typing CMPR on UNIX
command line), run CMPR.
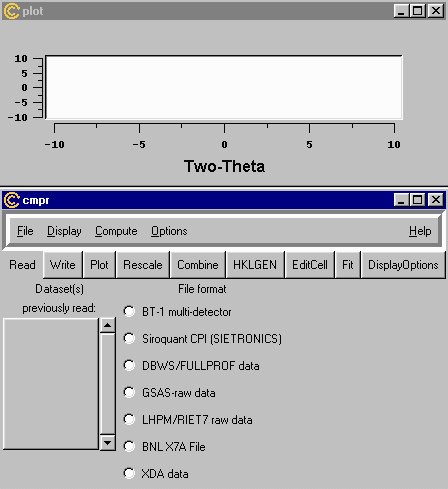
- This brings up the following two screens
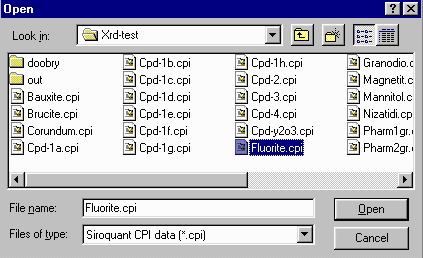
- After pressing the Open button, a small window will pop up telling you CMPR is loading
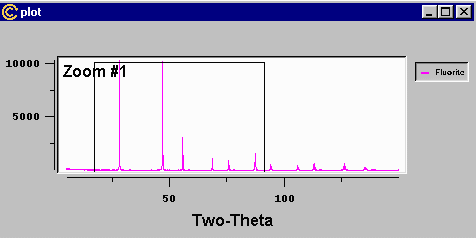
the file, after which it will display on the Plot Window (which is resizable - it is small
here for web demonstration purposes).
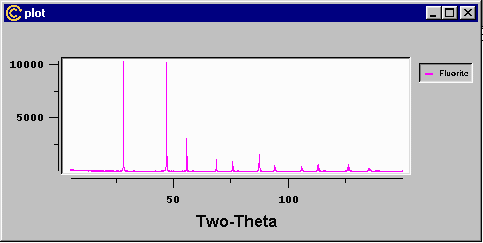
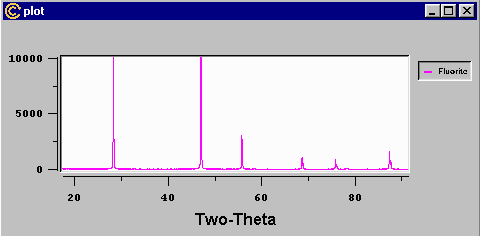
- The data in the plot windows cab be zoomed but click and drag with the mouse.
- To perform the manual indexing, click the Edit Cell button to
bring up the following window.
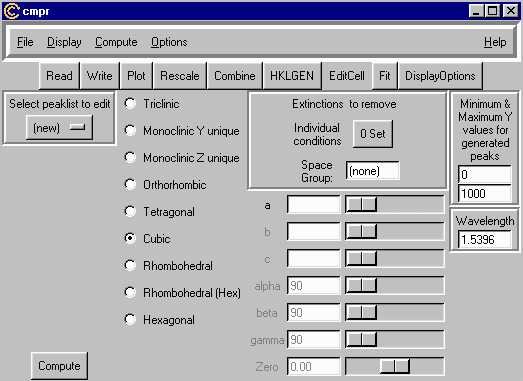
- You can generate multiple cells to overlap with the data. We will now do this for this cubic sample.
- Change the wavelength to the correct value (in this case 1.54056 A - Cu K alpha1); the height
you would like the calculated peaks to overlap the data (in counts - in this case -1500 to 0 counts
so that the lines are displayed under the powder pattern.);
select the cell type (in this case cubic); then enter rough cell values (in this case 6 - they
can be recalculated); then press the Compute button. Don't panic when you lose the
X-ray data from the screen. Reselecting the dataset will bring this back with the
calculated lines underneath. (If you want to limit the 2-theta range, go into the HKLGEN window
and set the 2theta max to what makes you happy)
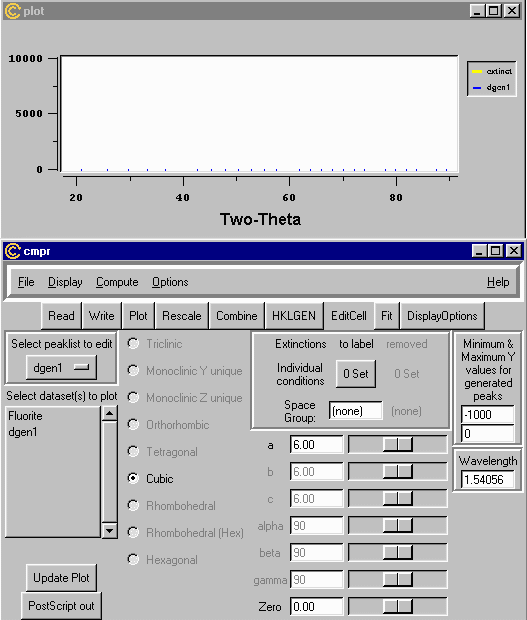
- As implied above, doubling clicking using the mouse on "Flourite" in the "Select dataset(s) to
plot" box will bring back with the calculated lines underneath. (you can also zoom to make this
a bit clearer)
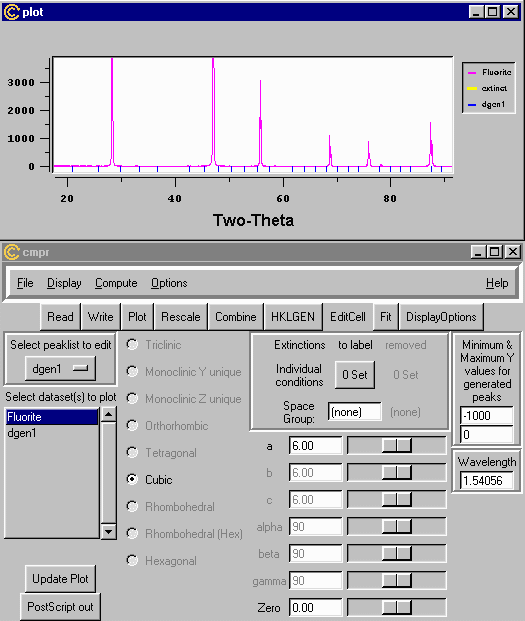
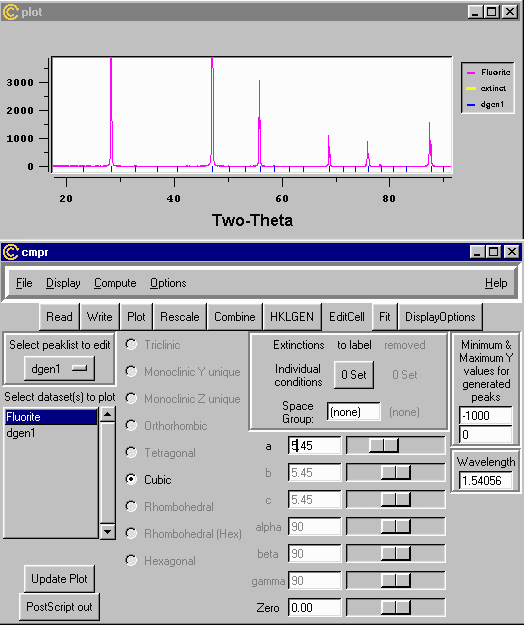
- If you move the a-axis scroll bar, the lines will move to keep pace with the changing
value of the cell value as it changes.
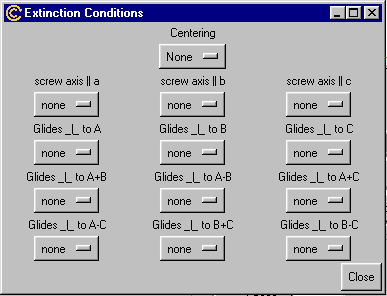
- It is also possible to specify symmetry operators and check what extinctions occur
using the Individual Conditions option.
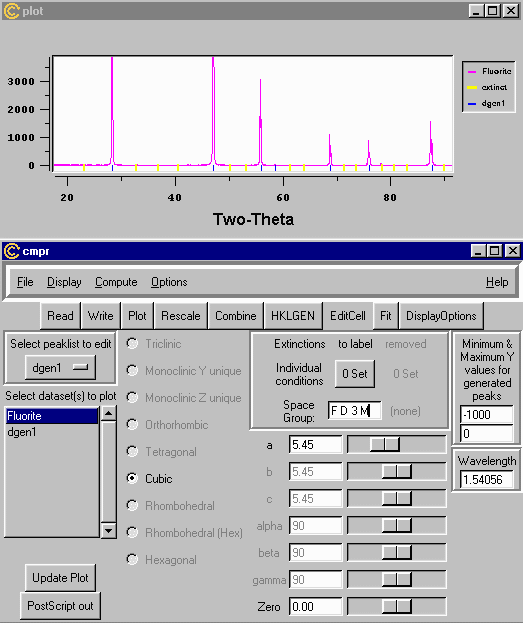
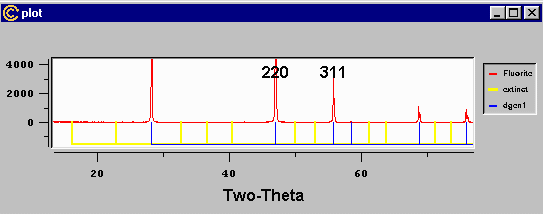
- You can also specify a space group - in this case F D 3 M, which seems to generate a
nice set of extinctions that match this particular dataset. In this case, yellow lines are
the extinct lines.
- You can also label HKLs on individual reflections by clicking [SHIFT] left mouse button.
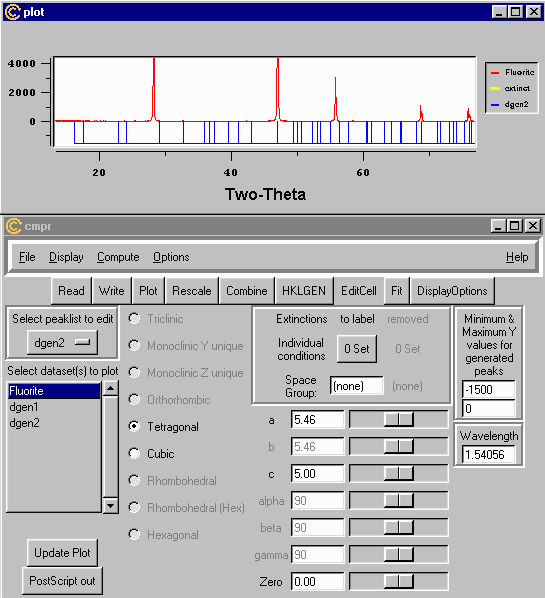
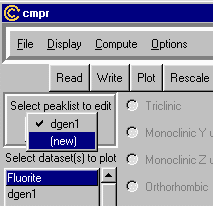
- By selecting a new peak list to edit(create), you can be exploring the effects of
symmetry changes to peak splitting. IN this case Cubic to Tetragonal.
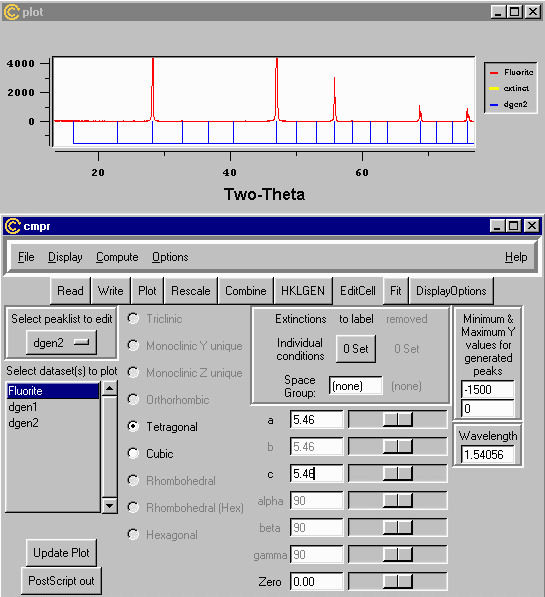
- Scrolling the A-axis or C-Axis control now lets you see the effects of
distorting the cell from Cubic to Tetragonal.
