[CCP14 Home: (Frames | No Frames)]
CCP14 Mirrors: [UK] | [CA] | [US] | [AU]

(This Webpage Page in No Frames Mode)

CCP14

Methods, Problems and Solutions - and Tutorials

GSAS (General Structure Analysis System) Rietveld powder diffraction and Single Crystal software

Generating and Manipulating Fourier Maps from Powder Data in GSAS

The CCP14 Homepage is at http://www.ccp14.ac.uk

[Back to Tutorials] [Back to Problems and Solutions] [Back to GSAS Hints/Resources]

[The reference to use for GSAS in any resulting publications is: A.C. Larson and R.B. Von Dreele, "General Structure Analysis System (GSAS)", Los Alamos National Laboratory Report LAUR 86-748 (1994).]

The following example creates a DELF (difference) map to try and find a missing Oxygen atom in cubic Y2O3. Though maps such as FOBS and FCALC are done just as easily.

This example uses Cubic Y2O3 giving the two main Y atoms with the Oxygen atom missing and to be found using the Fourier Difference Map.

I A 3 a=b=c=10.6032 Angstrom
site Y  x  0.25      y  0.25     z   0.25     occ Y+3  num_posns  8
site Y  x  0.4673    y  0        z   0.25     occ Y+3  num_posns  24

The trick here with GSAS, Fourier Maps and Powder Diffraction data is not only to set up the Fourier Map options but also go into Least Squares Controls and use E (Change powder data Fobs extraction flag to ON) before doing the cycles of least squares.

NOTE: If wanting to do a difference map focussing on existing atoms. Rather than delete the atoms; another way to do this would be to set the FRAC (occupancy) of the atom(s) of interest to zero; fixing atomic refinement parameters, then doing zero cycles of refinement. The advantage of this is that the atoms of interest will still be present (can be labelled) in the VRML/Forplot plot files.


  • (The following assumes you have profiled the pattern and refined on the known atoms)

  • The control of the refinement and setting up the parameters for the fourier map is performed in the Expedt module

  • Via the GSAS menu, select Setup, Expedt

  • You are normally prompted whether you wish to make a backup, not make a backup file or review a previous file. Normally Y for creating a backup is a good idea.

  • At this point, enter F to enter Fourier calculation set up.

  • When prompted select, DELF to set up a difference Fourier Map and go for an X section.

  • When prompted, select Y for individual map steps and choose 0.1 for X, Y and Z. And we want to generate the map in the range of 0 1 for X, 0 1 for Y and 0 1 for Z.

  • When prompted, include Histogram 1 by typing 1 0.

  • Done. Though you can optimise or set up for other types of maps if you wish.


  • Now, still in EXPEDT, go into L Least Squares Refinement set up, L Edit Least Squares Controls. Enter E and confirm that the following Fo's will be extracted from this histogram is set.

  • Now everything is setup that after doing some cycles of Least Squares (even zero cycles), you will then be able to generate a Fourier map. Thus go into Genles and do some cycles of refinement.


  • From the main menu, run Compute, Fourier which will generate the Fourier Map.


Peak search of the Fourier Map

  • To search for peaks in the fourier map (in this case, difference peaks of missing atoms), via the main menu, do Compute Forsrh.

  • Select a min peak cutoff (in this case 3), select number of peaks to be located (in this case 8); and do not append them to the EXP file.

    The range of map values is   -7.416 to   22.419
    Enter min. Peak value (negative if negative values are desired) >3
    Enter number of peaks to be located (1 to 225) >8
    Save the peaks located in the EXP file? (Y,) >
    
    Min rho =    3.00000  No. of peaks =   8  Peaks saved? N
    
    The following peaks were found
               Rho       X       Y       Z
       1      21.977   .0000   .7500   .0310
       2      16.015   .2505   .2500   .2500
       3      10.458   .1107   .3543   .1149
       4       5.070   .1200   .1176   .1191
    
    Total CPU time for FORSRH was 145.17 seconds
    FORSRH terminated successfully.
  • Be wary that some of the major peaks can be noise/misfit around the major heavy atoms so checking out bond-distances and angles can be an assistance. In this example, the 3rd peak (10.458 .1107 .3543 .1149) turns out to be the missing Oxygen.


  • To interactively visualise the map in 2D, run Graphics, Forplot.

  • Forplot has a wide range of functionality of which only a small subset will be covered here.

  • Height of section above center is    .000 A
    The map size - center to edge is   5.00 A
    The map grid interval is  .300 A
    Enter FORPLOT command (<?>,A,C,D,G,F,H,I,L,M,N,P,Q,R,S,T,V) >
    FORPLOT commands:
     <?>   - Type this help listing
     A     - Define map center and orientation by entering 3 or 4 atom seq. numbers
     C c   - Set map center
     D     - Set atom labeling limit
     F     - Read a different Fourier map
     G g   - Set grid interval "g" in A (default = .3)
     H h   - Set height "h" of section above center in A
     I v   - Select contour interval in rho "v"
     L     - List current settings
     M v   - Select minimum rho value "v" (default = 0.0)
     N n   - Select number of contours "n" and assign their values
     P     - Plot map
     Q     - Quit FORPLOT
     R a r - Enter axis (x,y,or z) and angle for rotation of current drawing
     S s   - Set map size - center to edge (default = 5.0 A)
     T x y z  - Display rho at "x,y,z"
     V u v - Set map orientation vectors "u" and "v" (Enter 6 values)
             Map horizontal is u and normal is uxv
    Enter FORPLOT command (<?>,A,C,D,G,F,H,I,L,M,N,P,Q,R,S,T,V) >

  • For instance, to see where existing atoms are projected, you can use D Set atom labeling limit to have atoms labeled a user defined distance from the slice being viewed. (e.g., 2 Angstrom).

  • H (Set height "h" of section above center in A) to match the above found oxygen atom so you can visually look at the peak. In the following graphics window, you can use the mouse and keyboard to graphically center the map on a desired area and obtain co-ordinates.
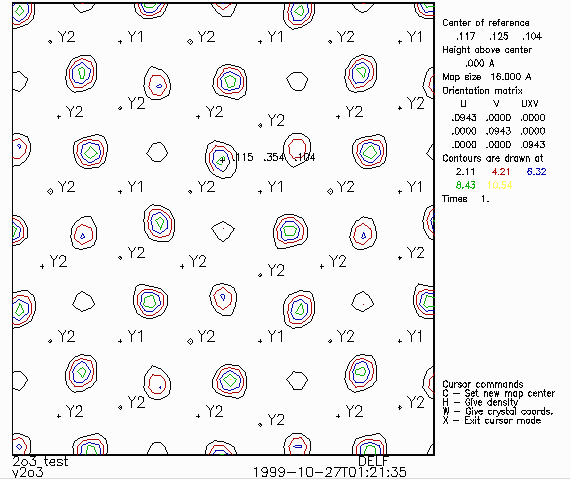
  • Visual examination of a difference map in GSAS Forplot


[Back to Tutorials] [Back to Problems and Solutions] [Back to GSAS Hints/Resources]

[CCP14 Home: (Frames | No Frames)]
CCP14 Mirrors: [UK] | [CA] | [US] | [AU]

(This Webpage Page in No Frames Mode)

If you have any queries or comments, please feel free to contact the CCP14