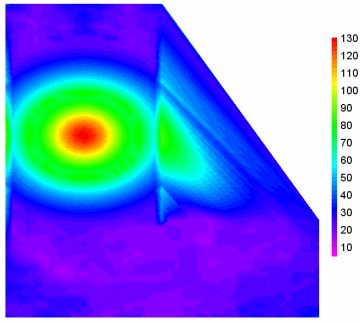
When you import X,Y,Z values into a surface plot in DPlot, it must make an assumption about what the boundary of the surface looks like, since a table of X,Y,Z points contains no connectivity information or any clues about which points define the outside edges of the surface. The assumption made by DPlot is that the surface is convex - it will never produce a triangular mesh with concave exterior angles or with interior holes. For a great many problems this will be the "correct" surface, but in many cases is clearly incorrect. One of those cases is shown here:
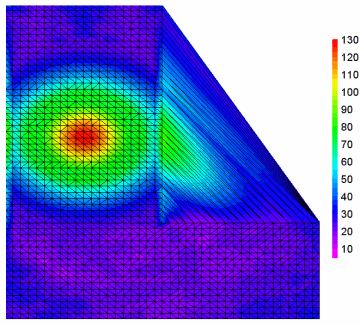
This plot shows a plan view of contours of some phenomenon measured at various gauge locations in an L-shaped room. What happened to the L-shape? To help understand what happened here we draw the borders of each triangle in the triangular mesh generated by DPlot (on the Contour Options dialog, check Borders):
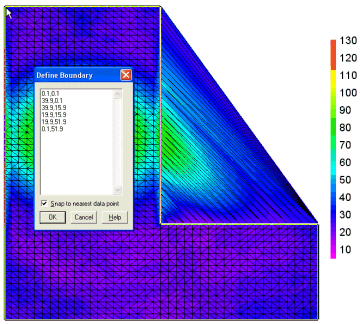
The plot includes triangles outside our room that we don't want, simply because of the assumption made that the surface boundary is convex. This can be remedied with the Define Boundary command on the Options menu. This command allows you to specify the endpoints of the line segments that form the exterior boundary of your surface. (You can also use this command to specify holes in your surface).
The border may start at any location and proceed in either a clockwise or counterclockwise direction around the surface. Border points do not necessarily have to be on the surface. As you enter each line or click on the plot to pick a boundary point you will see the border being updated on the plot, drawn as a reverse video line.
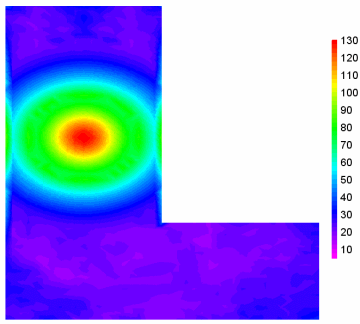
After entering all border points and selecting OK, DPlot will delete any triangles whose average X and Y value is outside the border. The average value is used as a check simply because it is mathematically trivial to compute and it is guaranteed to be inside the triangle. Note that this command will not clip triangles which cross the border but whose average value is inside the border. The final result:
Depending on the complexity of the boundary and the density of the data points in your input, the Define Boundary command will in some cases be insufficient to get the boundary shape you want. In those cases additional data points may be needed. One such case is shown below. This plot consists of 20 points that are the vertices of 2 concentric star shapes, 10 points each.
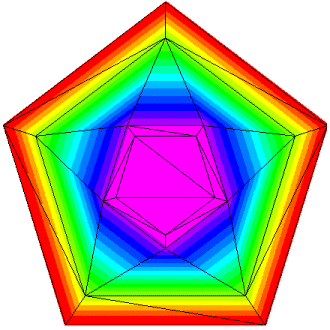
We want the exterior border to be the outer edge of the larger star. So we use "Define Boundary" and pick those points. The picture below shows the same plot with the boundary drawn in reverse video.
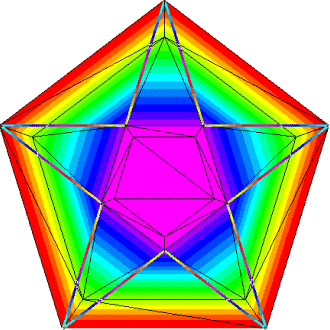
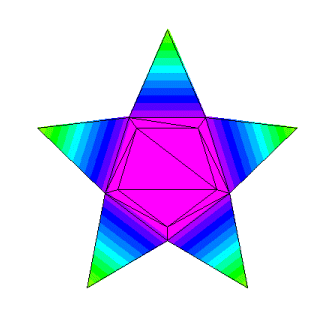
You can see that several triangles cross over the boundary line segments. This creates the following plot, which isn't what we intended at all:
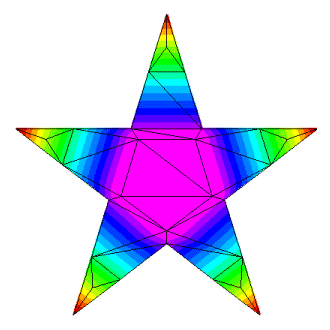
If we go back and add nodes at the midpoints of each outer line segment of our largest star, then the triangulation looks quite a bit different:
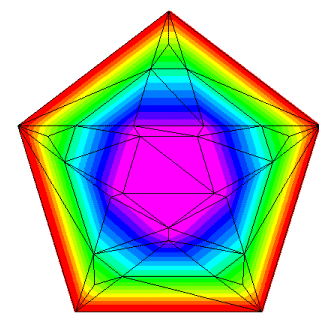
Notice that all triangles are now completely inside or completely outside our desired border. Selecting the same border points as before, we now get:
Privacy Policy
