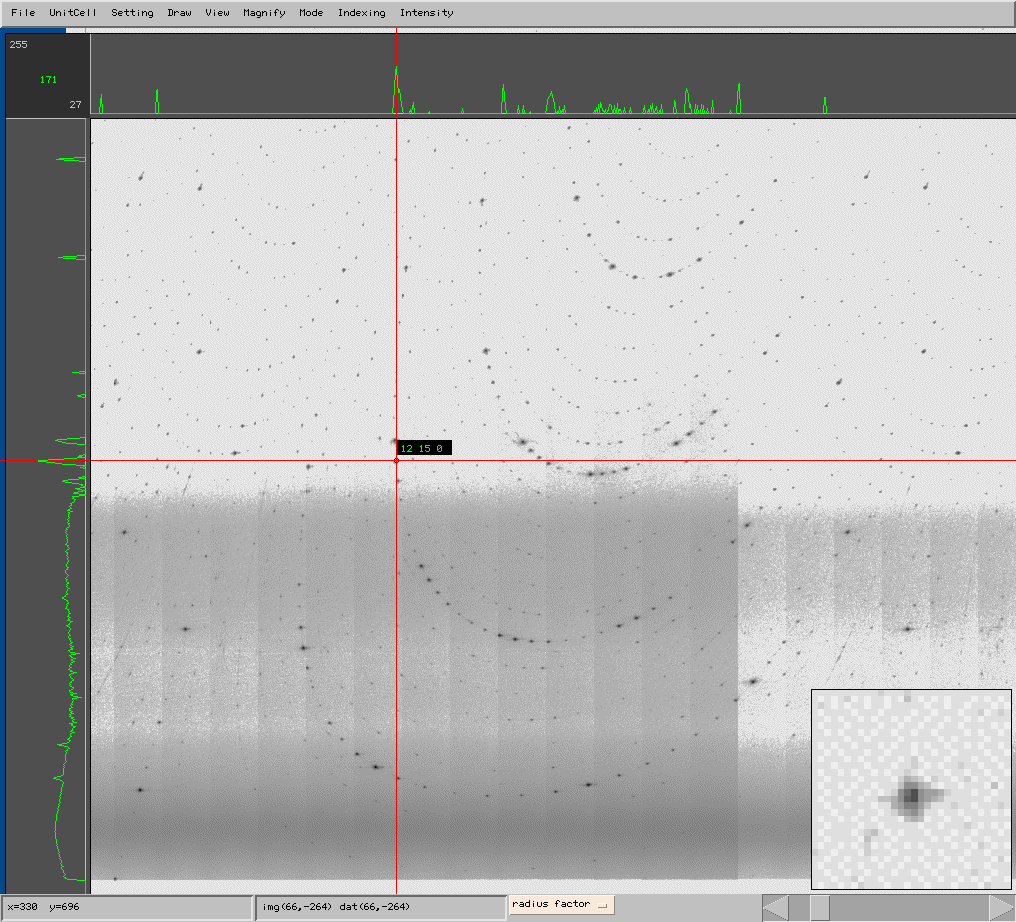
Intensity profiles are visualized in this histogram mode. The window on the bottom right shows a zoomed image of the target peak.

Intensity profiles are visualized in this histogram mode. The window on the bottom right shows a zoomed image of the target peak.