
|

|
|
| Home | Instruments | Science | Experiments | SiteMap |
Intro Next page Previous page
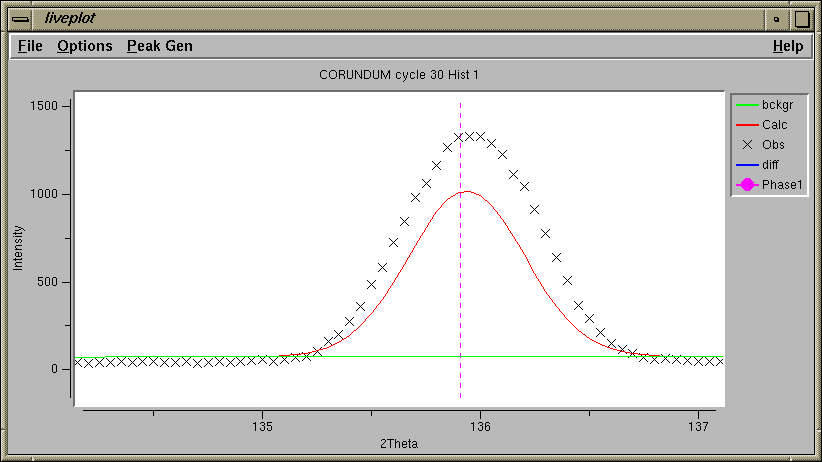
After the unit cell is fit, the next step is typically to improve the crystallographic model if the profile is well-fit. In this case, however, we cannot do that since the high-angle peaks are much broader than the calculated pattern. This is demonstrated clearly in the LIVEPLOT output shown below.
GSAS/EXPGUI Alumina tutorial (part 9)
Initial Fitting of Profile Parameters
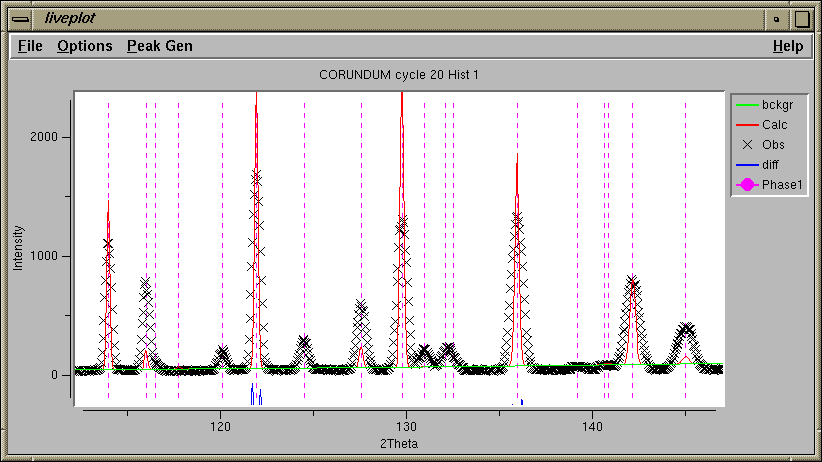
The plot above shows several problems that need to be addressed by refining parameters. As noted before, the observed peaks are significantly broader than the calculated, this is addressed by optimizing the peak shape parameters. Also, the relative intensities in the calculated pattern does not match the observed intensities, this can potentially be addressed by refinement of coordinates and, to a lesser extent, individual displacement (temperature) parameters. It is also worth noting that the computed background is too high at higher two-theta values. This may be improved by refinement of the background when the peak intensities are better fit or may require the addition of more background parameters. In any case, neither the coordinates or the background can be effectively optimized until a reasonable fit is obtained for the peak shape.In the Profile panel shown below, the three Gaussian peak width terms (GU, GV & GW, also known as the Cagilloti terms U, V & W), are added to the refinement.
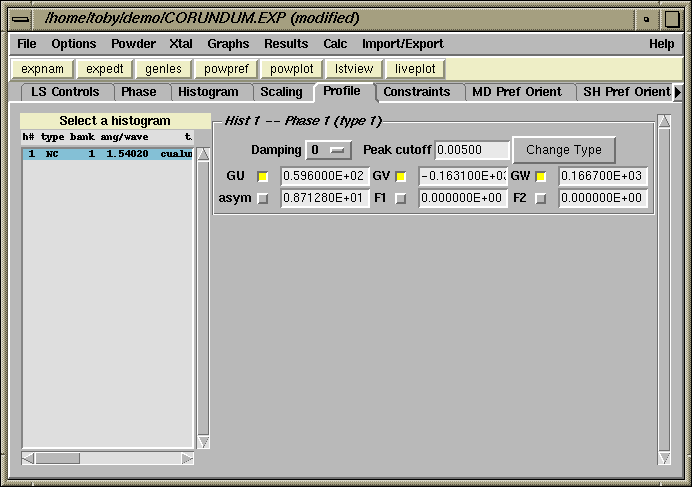
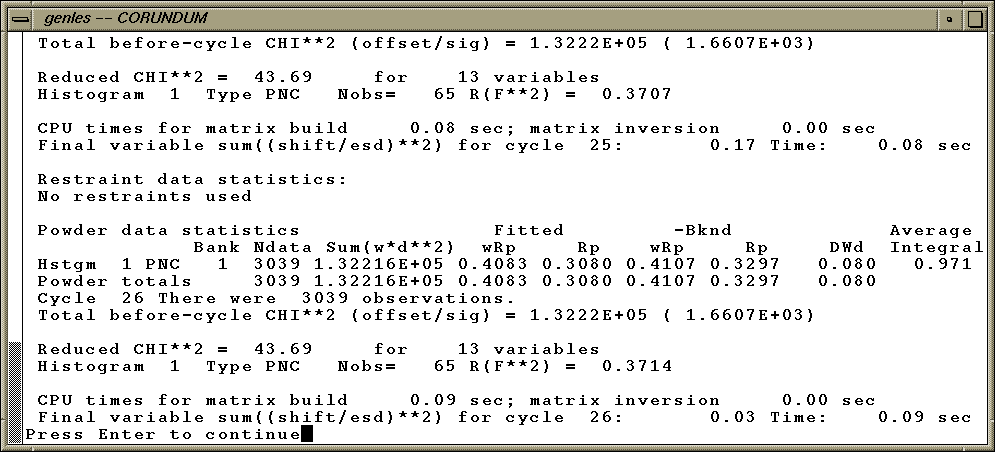
After the flags are set for the profile terms, the GENLES program is rerun. At this point, the fit improves considerably.
If the fit is examined closely at this stage with LIVEPLOT (as shown below), it can be seen that the peaks at high angle appear to be trucated on each side. This is due to the fact that the peak profiles have gotten much broader, but POWPREF has not yet been rerun, so not enough data points are included in the computation.
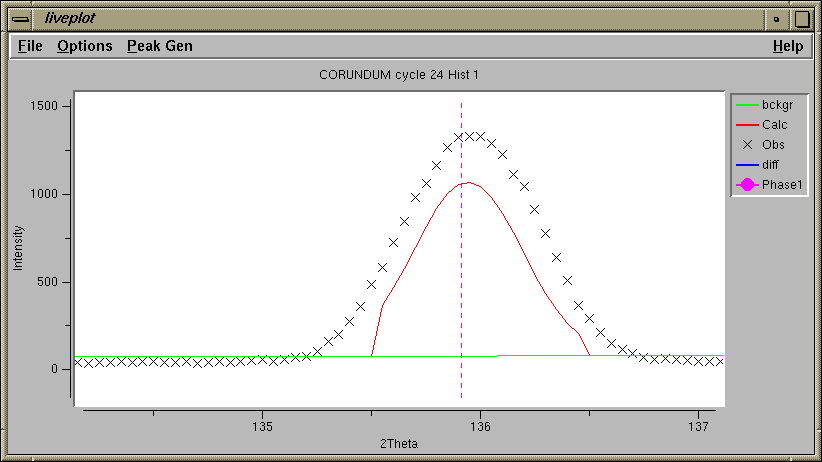
This sort of problem occurs fairly commonly for neophyte GSAS users. The way to avoid this is to remember to rerun POWPREF after any significant change in the lattice parameters, zero correction or peak profile terms. Also be sure to run POWPREF after adding phases, histograms or changing the excluded regions.Run POWPREF and then GENLES again. Note that still more improvement is seen in the Chi-squared and R-factors.
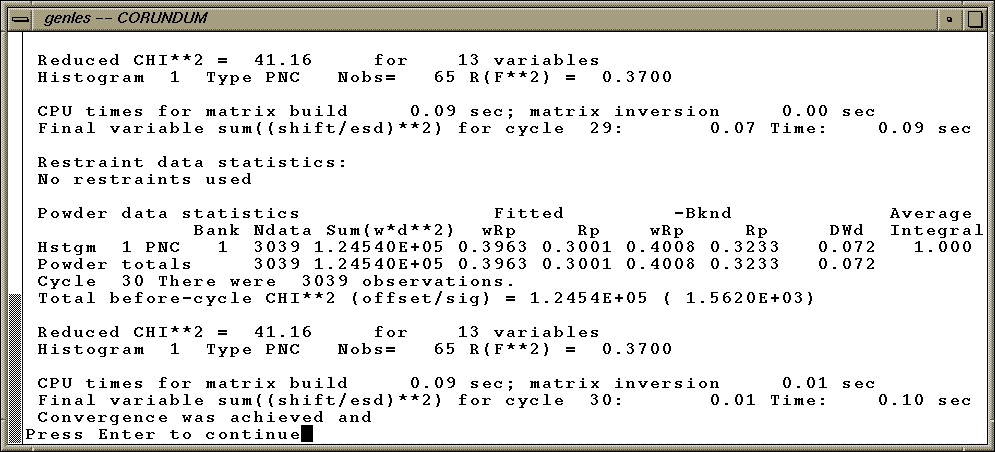
Now LIVEPLOT shows a normally-shaped diffraction peak.
Previous: Fit the Diffractometer Zero Correction
Next step: Group Uiso parameters; Refine coordinates and Overall Uiso.
Comments, corrections or questions: crystal@NIST.gov
Last modified 18-July-2003
$Revision: 1.1 $ $Date: 2002/07/18 20:45:10 $