FROM THE EXACT FORMULAE
TO THE PEAK SHAPES USED IN THE RIETVELD METHOD,
WHAT APPROXIMATIONS ARE
INTRODUCED ?
Let us see the meaning of some analytical profile shapes regarding size and microstrain effects as defined by Warren, in the hypothesis of symmetrical f profile shapes :

The size distribution
function P(j), fraction of columns of length
M = ja3,
is directly related to the size Fourier coefficients.
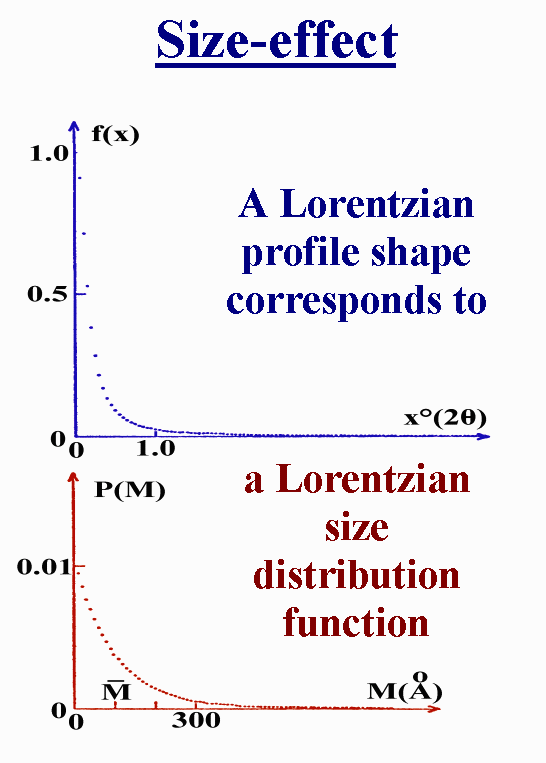
Now some examples of profile
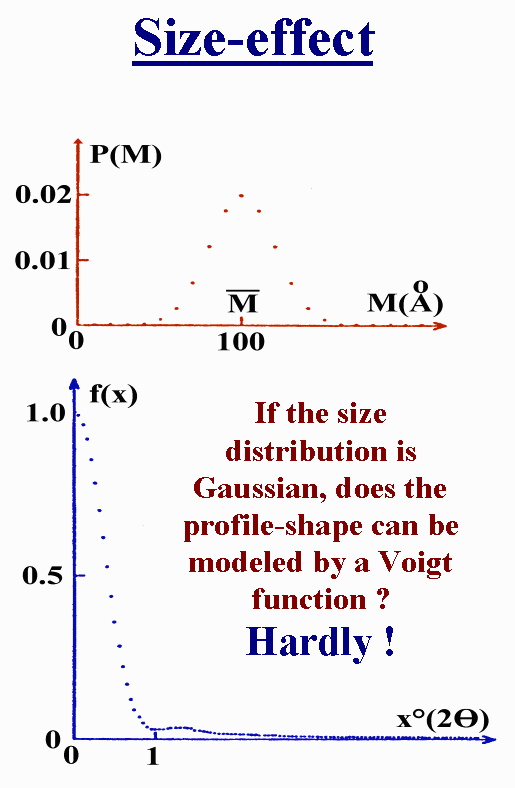
shapes as corresponding to selected size distribution functions :

Another one :

About the microstrain :
A Gaussian peak shape is expected if the distortion is Gaussian, and if the mean squared distortion varies as the square of the distance :
<Z2n> = n2 <Z21>
A Lorentzian peak shape is expected if the distortion is Gaussian, and if the mean squared distortion varies as the distance :
<Z2n> = n <Z21>
Any hypothesis of this
order has chances to be more or less wrong, the best is to have parameters
sufficiently flexible...
Those equations are for
one series of harmonics in a reflection family (00l for instance).
If the broadening effects are different in each hkl reflection family
(anisotropy), then you will have a huge number of Fourier coefficients
to manage, a problem reputed impossible to solve because of reflection
overlapping.
Alternative is to try
to describe the anisotropy by global expressions depending on the hkl
indices
Let us scrutinize first a typical very recent paper explaining how approximations are introduced :
Fourier modelling of the
anisotropic line broadening of XRD profiles due to line and plane lattice
defects.
Scardi, P. & Leoni,
M. (1999). J. Appl. Cryst. 32, 671-682.
From the paper abstract : Applications to face-centred cubic structure materials provided detailed information on the defect structure : dislocation density and cut-off radius, stacking- and twin-fault probabilities were refined together with the structural parameters.
It is certainly interesting
to look accurately at the way the microstructure parameters were introduced.
Reading the paper, one
can note that the method was applied to two similar cases (fcc materials)
but no evidence was given about the reliability and accuracy of the estimated
physical parameters (size, dislocation density, stacking fault and twinning
probabilities...) which could be expected from this technique. No standard
material was studied, no alternative method was used for comparison. No
theoretical pattern was simulated by using the "true" (Warren) equations
(or better, the Debye scattering equation) which then could have been treated
by the approximate equations developed in the manuscript so that the effect
of those approximations could have been estimated.
The title is misleading. "Fourier modelling" is hardly applicable here since pseudo-Voigt functions are used : so that the profile shapes are not at all produced by inverting size and strain non-analytical Fourier series.
The pseudo-Vogt functions retained is :

Note that by doing this, the authors have decided that the profiles will be pseudo-Voigt, without any justification.
And it is said : "The two components (Gaussian and Cauchy) have been assumed to have the same half width at half maximum (HWHM)".
Why assuming that ?
This is a clear limitation which cannot allow the authors to claim the proposal of a general method. Moreover, what about the distribution of size effect in the Cauchy and Gaussian parts, and what about of distortion effect repartition in the Cauchy and Gaussian parts ? It will be shown later in these comments that the assumption made here is the dubious key allowing to establish the final equations. This assumption should be clearly justified on the point of view of size and strain effects, but it is not.
Now, the Fourier transform
of the pseudo-Voigt is defined as :

And the size-strain model has now to be introduced inside it.
The limit for L tending
toward 0 of the first derivative of the size-strain Fourier coefficient
is :

the negative inverse
mean size Me of the coherently diffracting domains.
So that the authors assimilate
the first derivative limit of the pseudo-Voigt Fourier transform to the
same value. This seems logical after having arbitrarily decided that the
shapes will be pseudo-Voigtian :

This allows to relate
the widh parameter of the Gaussian and Lorentzian parts to the mean size
Me,
so that the Fourier transform of the pseudo-Voigt becomes :

We have now ONLY size
effect (no microstrain) in both the Gaussian and the Lorentzian parts of
the pseudo-Voigt . And this is possible exclusively because the HWHMs are
assumed to be equal in the Gaussian and Cauchy parts.
The authors will use another
approximation in order to introduce the lattice-distortion terms :

And they will assume
that this expression is even true for L = Me/2,
meaning that the size Fourier coefficients correspond to a Cauchy function
up to half the mean size, so that the size distribution corresponds also
to a Cauchy function up to half the mean size.
Afterthat, the size-strain
Fourier coefficient for L = Me/2 becomes :

This equation is now made equal to the pseudo-Voigt Fourier transform for L = Me/2 and the final expression is obtained :

What is done here is to make equal an expression containing only the mean size Me and an expression containing both the size and strain effects, for a particular value of L = Me/2. Both expressions being previously highly arranged and approximated.
That final expression connects the mean size Me and the mean square distortion <e2Me/2> , at L = Me/2, with the HWHM and the mixing parameter of a pseudo-Voigt function.
Note that this equation
established for L = Me/2 is now implicitly declared
as valid for any L value.
Is that serious ?
A lot of equation manipulations,
hard to justify.
Well, it is published...
and there is no alternative.
So you will have to make
your own opinion about the credibility of such a demonstration, and the
meaning of the Me and <e2Me/2>
values that you will extract from your data when applying all those approximations.
One has always in the physical parameters the consequence of the approximations retained. Those approximations remain highly disputable in this paper.